Machine Learning is a field that requires a solid understanding of various algorithms — some of which can be complex, while others are easier to grasp. One of the first algorithms most people learn when starting with machine learning is Linear Regression.
If you're a beginner looking to understand how Linear Regression works, this article is for you. I've explained Linear Regression in the simplest terms, making it easy for anyone starting their machine learning journey to follow. In this article, we will focus on the most basic form of Linear Regression, called "Simple Linear Regression."
1. Linear Regression is a Foundation Algorithm
Linear Regression is often considered one of the most fundamental algorithms in machine learning. Its simplicity makes it an ideal starting point for anyone new to the field. The concept is easy to grasp because it relies on fitting a straight line through data points in such a way that it best represents the relationship between two variables.
2. Linear Regression is a Supervised Learning Algorithm
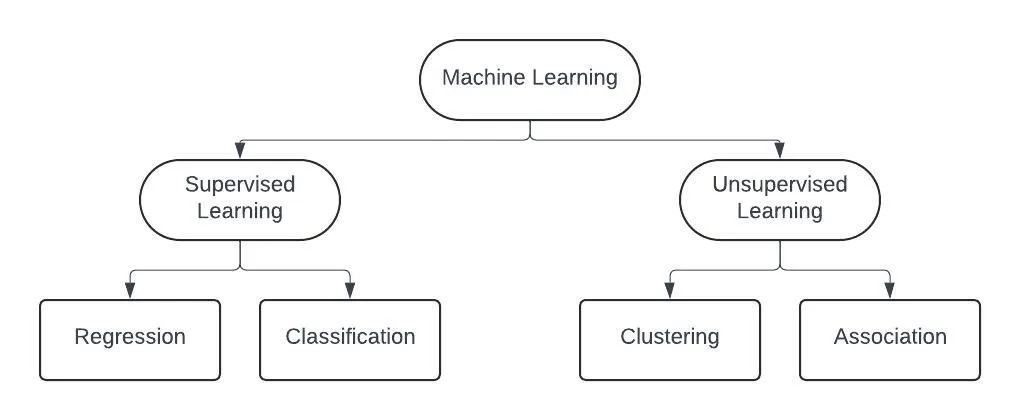
Linear Regression falls under the category of supervised learning algorithms, which means that it learns from labeled data. In Machine Learning there are two types of learnings, Supervised and Unsupervised.
- In supervised learning, the model is provided with both input data and the corresponding output (target).
- In unsupervised learning, the model is only given input data without any labels or outputs, and the goal is to find hidden patterns or relationships within the data.
There are two types of supervised learning problems — regression problems and classification problems.
3. Types of Linear Regression: Simple, Multiple, and Polynomial
Linear Regression can be categorised into different types based on the number of independent variables and the target variable.
- Simple Linear Regression: The most basic form, where there is one independent variable and one dependent variable.
- Multiple Linear Regression: The model deals with more than one independent variable.
- Polynomial Regression: Although still technically a form of linear regression, this method is useful when the data shows a non-linear relationship, and it helps capture curves in the data.
In this article, we are only focusing on Simple Linear Regression to get a better understanding of the core concept.
4. What does Linear Regression Actually Do?
If you read the definition, it might not be immediately clear. So let's take an example to see how Linear Regression works and the type of problem it solves, step by step. I have divided this into two parts so that you can understand what the core problem is and how we solve it.
Example Dataset and Problem:
Suppose we have a dataset of students who got placed during a campus placement drive.
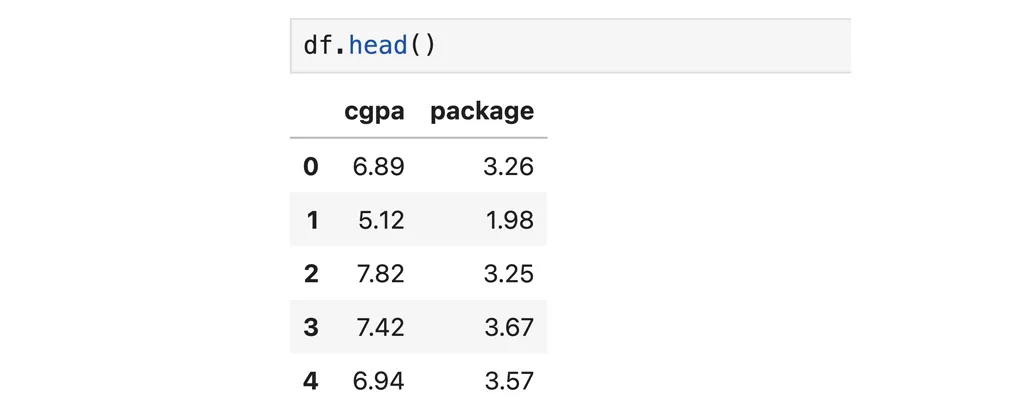
In this dataset we have only two columns — one is our independent variable (cgpa) and the other is our target variable (package). Now, if we have a regression problem where we need to predict how much package a student would get based on their CGPA, how would you do it?
Part A: The Ideal Scenario — Perfectly Linear Data
It would have been very easy to solve this problem if we had perfectly linear data. A perfectly linear dataset would look something like this:
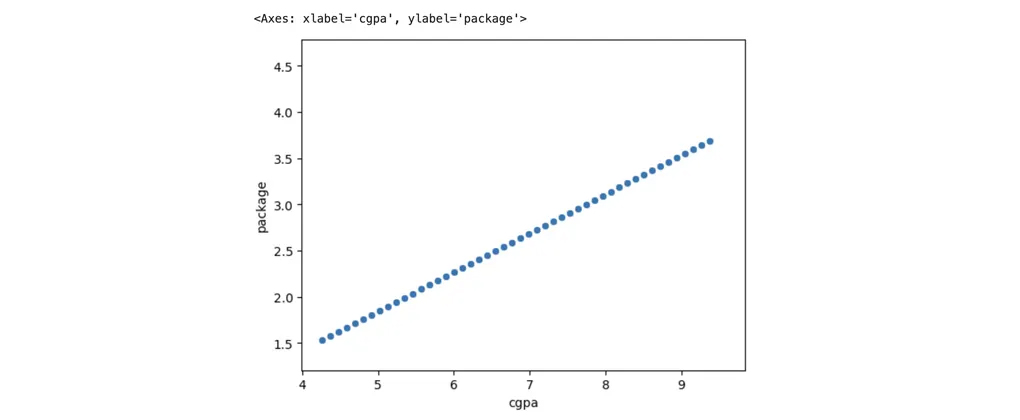
In this case, if someone asked us to predict the package for a particular CGPA, we would simply draw a line that passes through all the points, plot the CGPA value on the line, and check the corresponding package value on the y-axis.
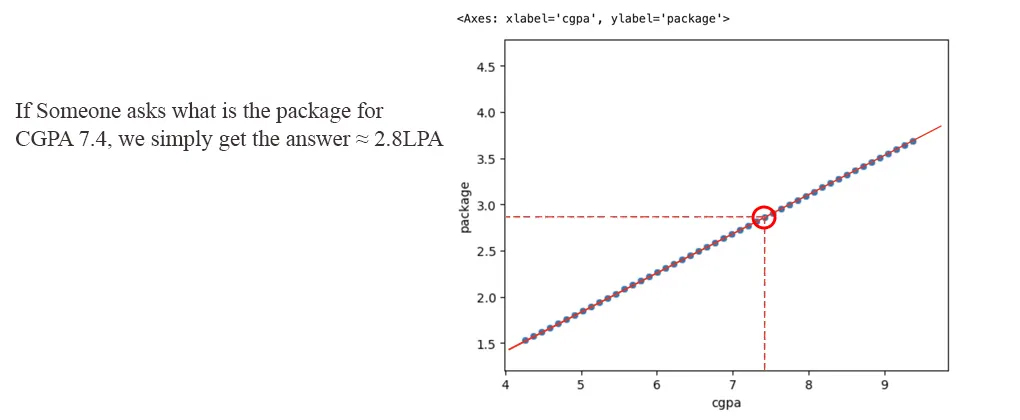
But that's not how things work in real life! The data we get in real world problems is never perfectly linear. This happens because of Stochastic Errors — caused by factors that we can't easily control or measure, such as random fluctuations in the environment or noise in the data. That is why our data is never perfectly linear, but it should be sort of linear!
Part B: The Reality — How Linear Regression Actually Works with Real-World Data
An actual real-world placements dataset of 200 students looks like this:
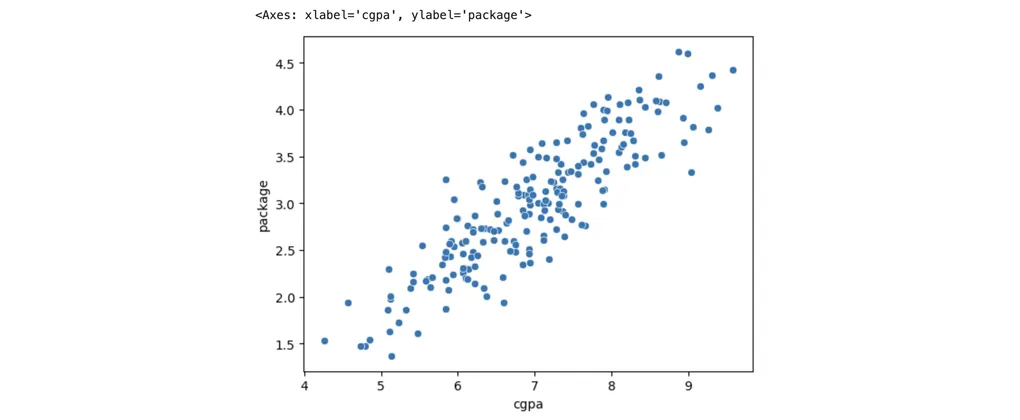
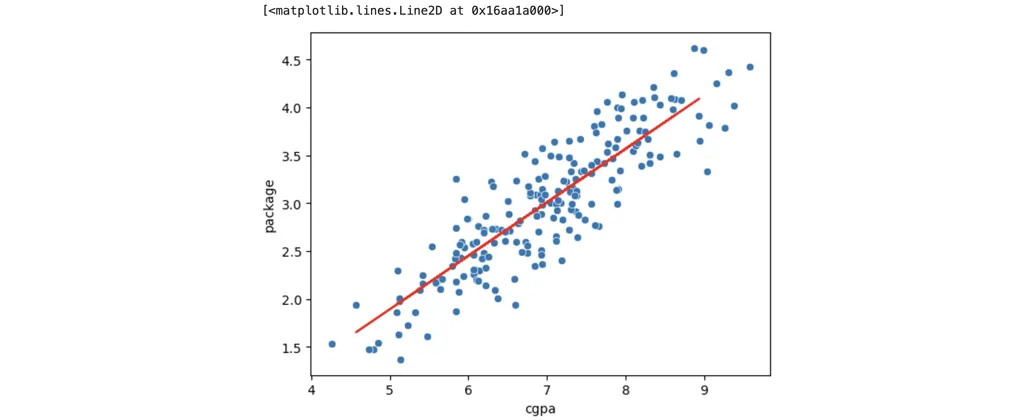
In real-world datasets, we cannot plot a line that passes through every data point. Instead, what the Linear Regression model does is draw a line that passes as close as possible to all the data points.
This line is called the 'Best Fit Line'. It's called the best fit line because it's the line that minimizes the errors the most.
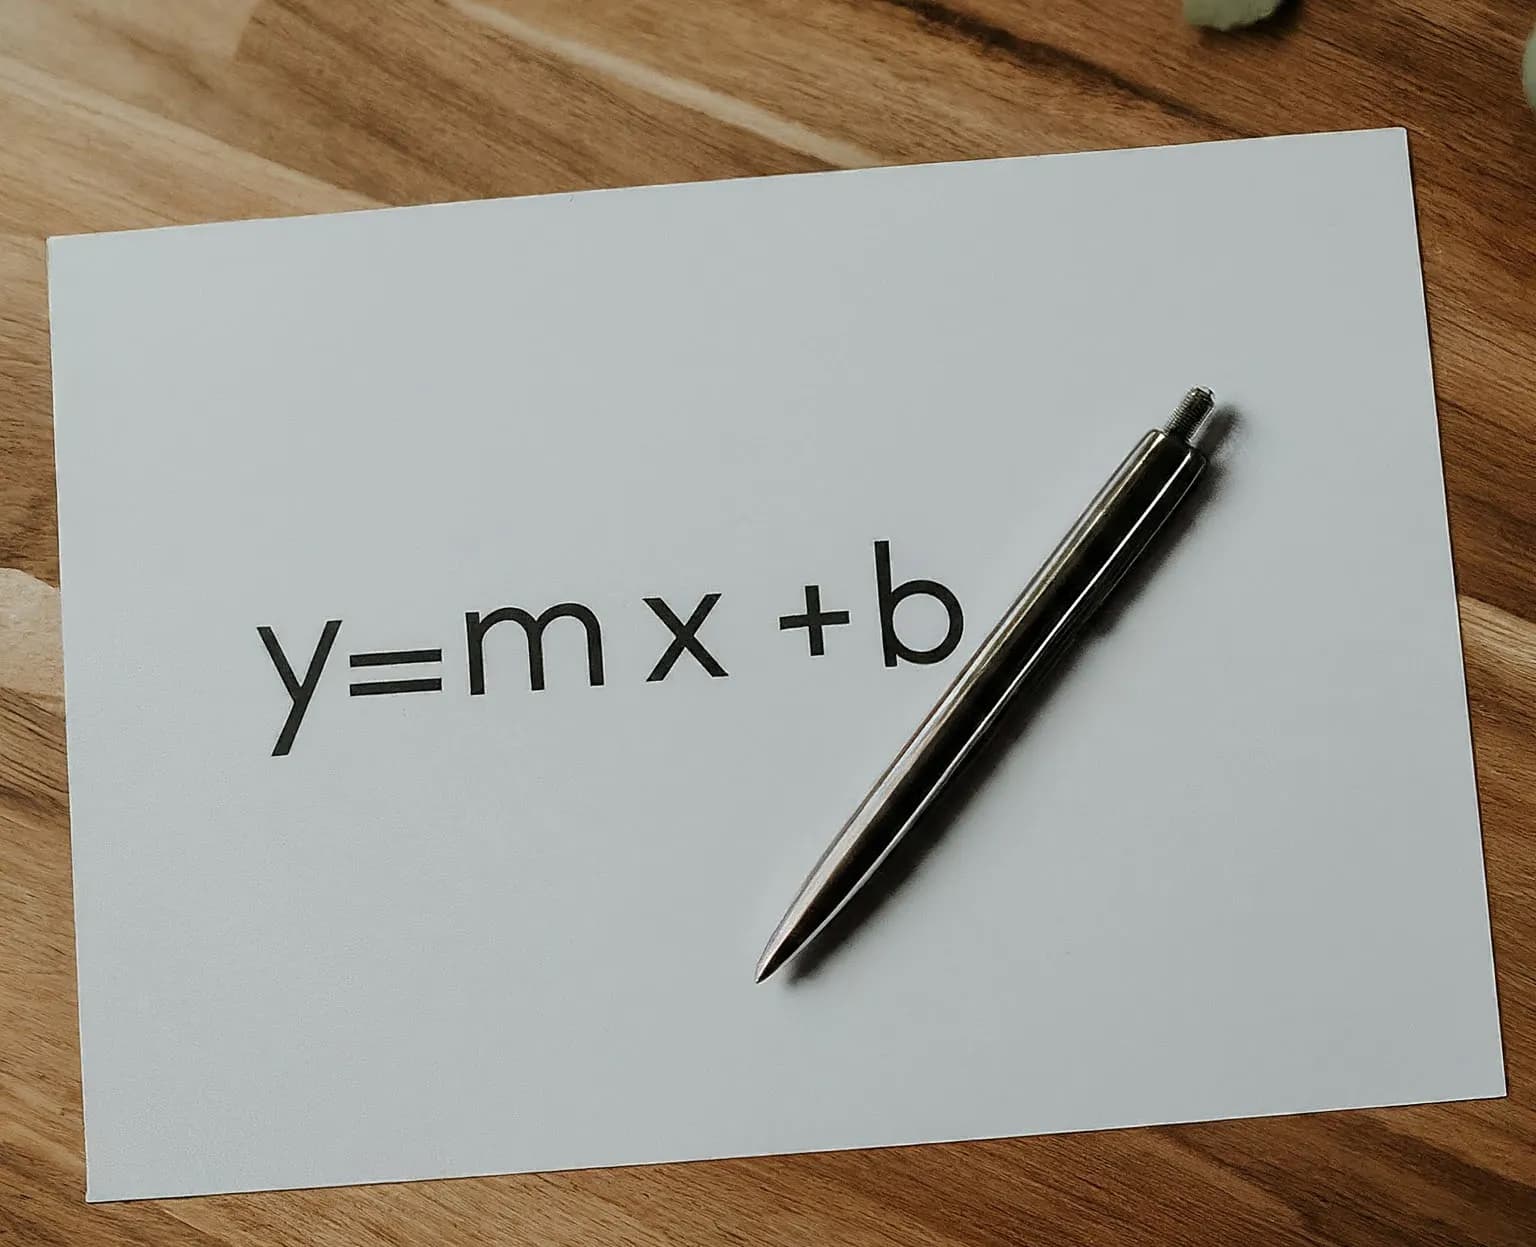
Once this line is plotted and our Linear Regression model is trained on the dataset, we can easily predict the package for any new CGPA value using the equation of the line:
y = mx + b
Where:
- y = the predicted package
- m = the slope of the line
- x = the CGPA
- b = the y-intercept
5. How is the Best Fit Line Plotted?
You might be wondering — how does our model find the best fit line?
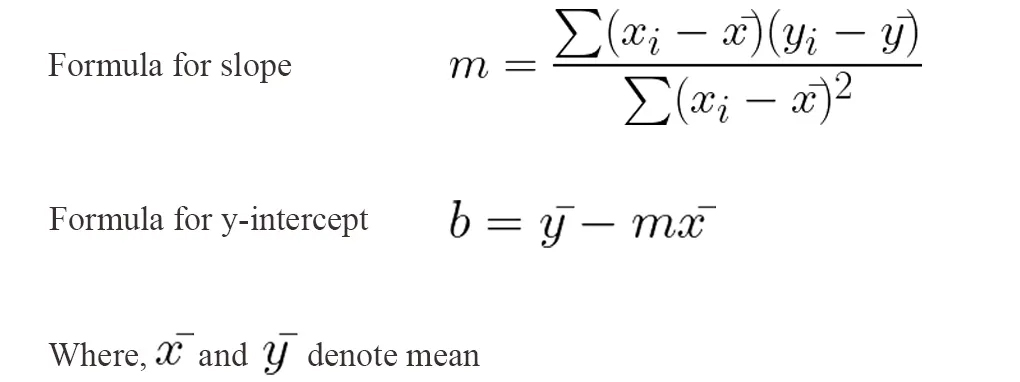
The answer is simple. When we fit our algorithm on our training dataset, it finds the slope (m) and the y-intercept (b) values based on our data. The formulae for finding slope and y-intercept are:
After finding the slope and y-intercept, a line is plotted on our data which passes closely to all the data points. During the prediction phase, our model is only solving the equation of the line i.e. y = mx + b.
This method of choosing the unknown parameters in a linear regression model is known as the OLS (Ordinary Least Squares) method, which is a closed form solution to solve linear regression problems.
This method works well for small-dimensional data, but as the number of columns increases and we deal with multi-dimensional data, it becomes less effective. In such cases, we need to use the Gradient Descent method, which is a non-closed form solution.
The slope of the line (m) decides at which angle our line would be, and the y-intercept determines where the line crosses the y-axis.
6. Simple Linear Regression Code from Scratch
I have created a custom class similar to the Linear Regression class in scikit-learn to help better understand how the formulas we discussed earlier are implemented under the hood.
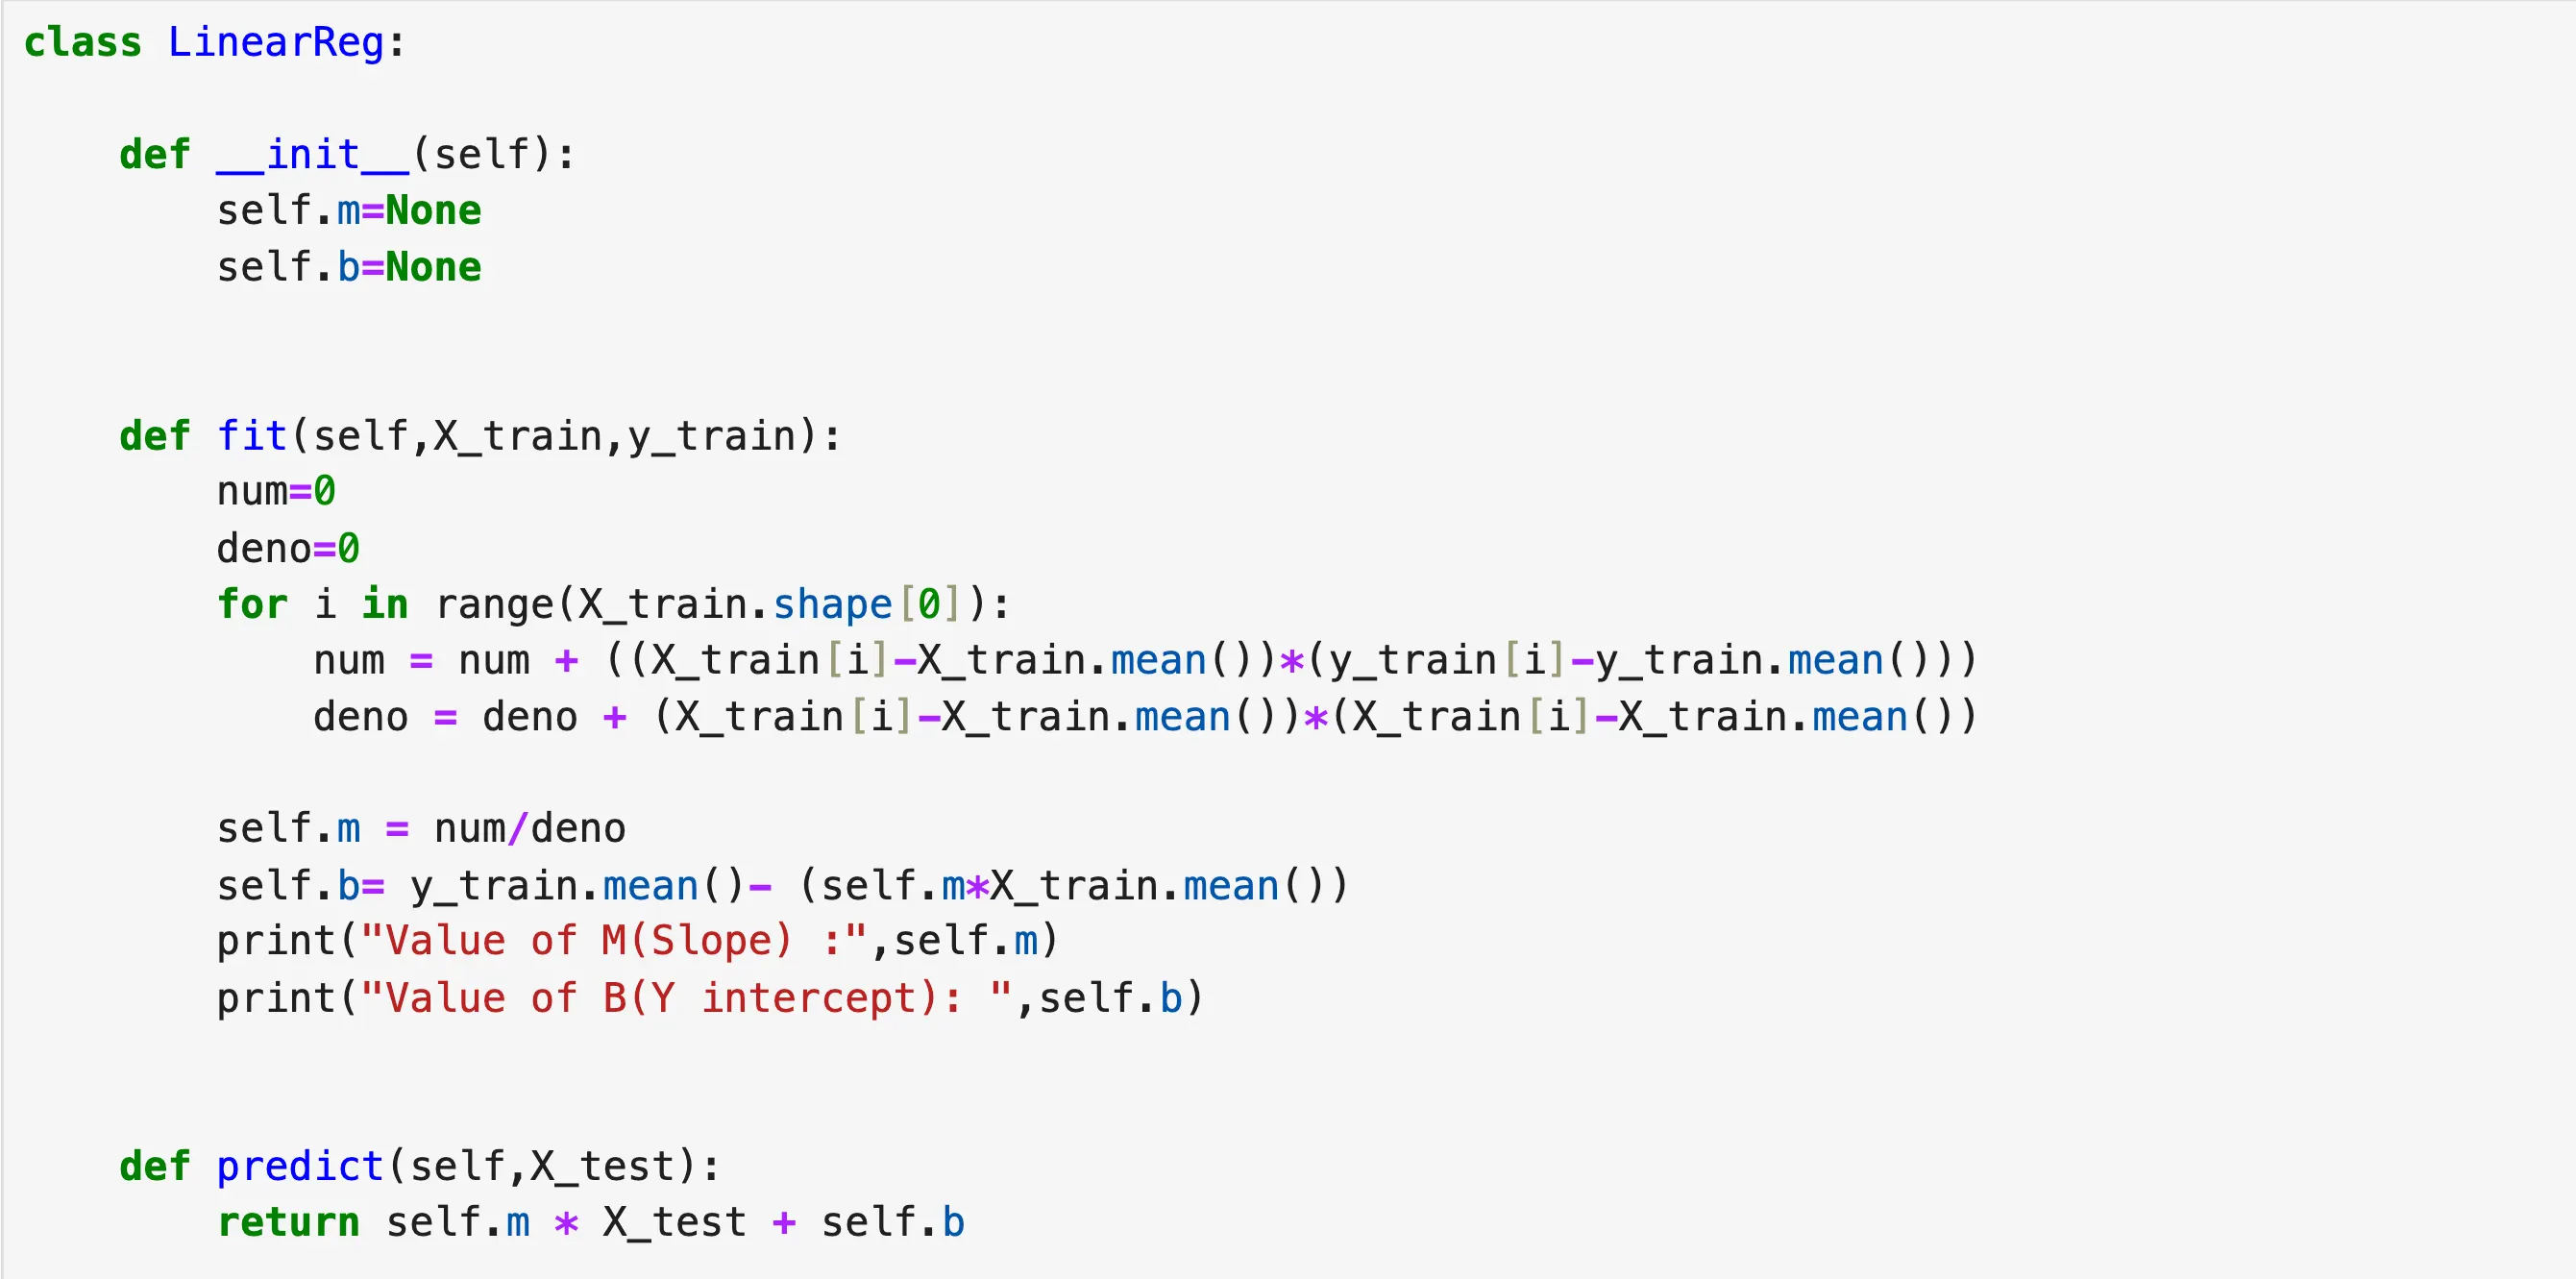
The above code clearly explains what happens in the background when we call the fit function. It takes our X_train and Y_train, finds the slope and y-intercept based on the data using the formulas we discussed earlier. The predict function just solves the equation of the line and returns the output.
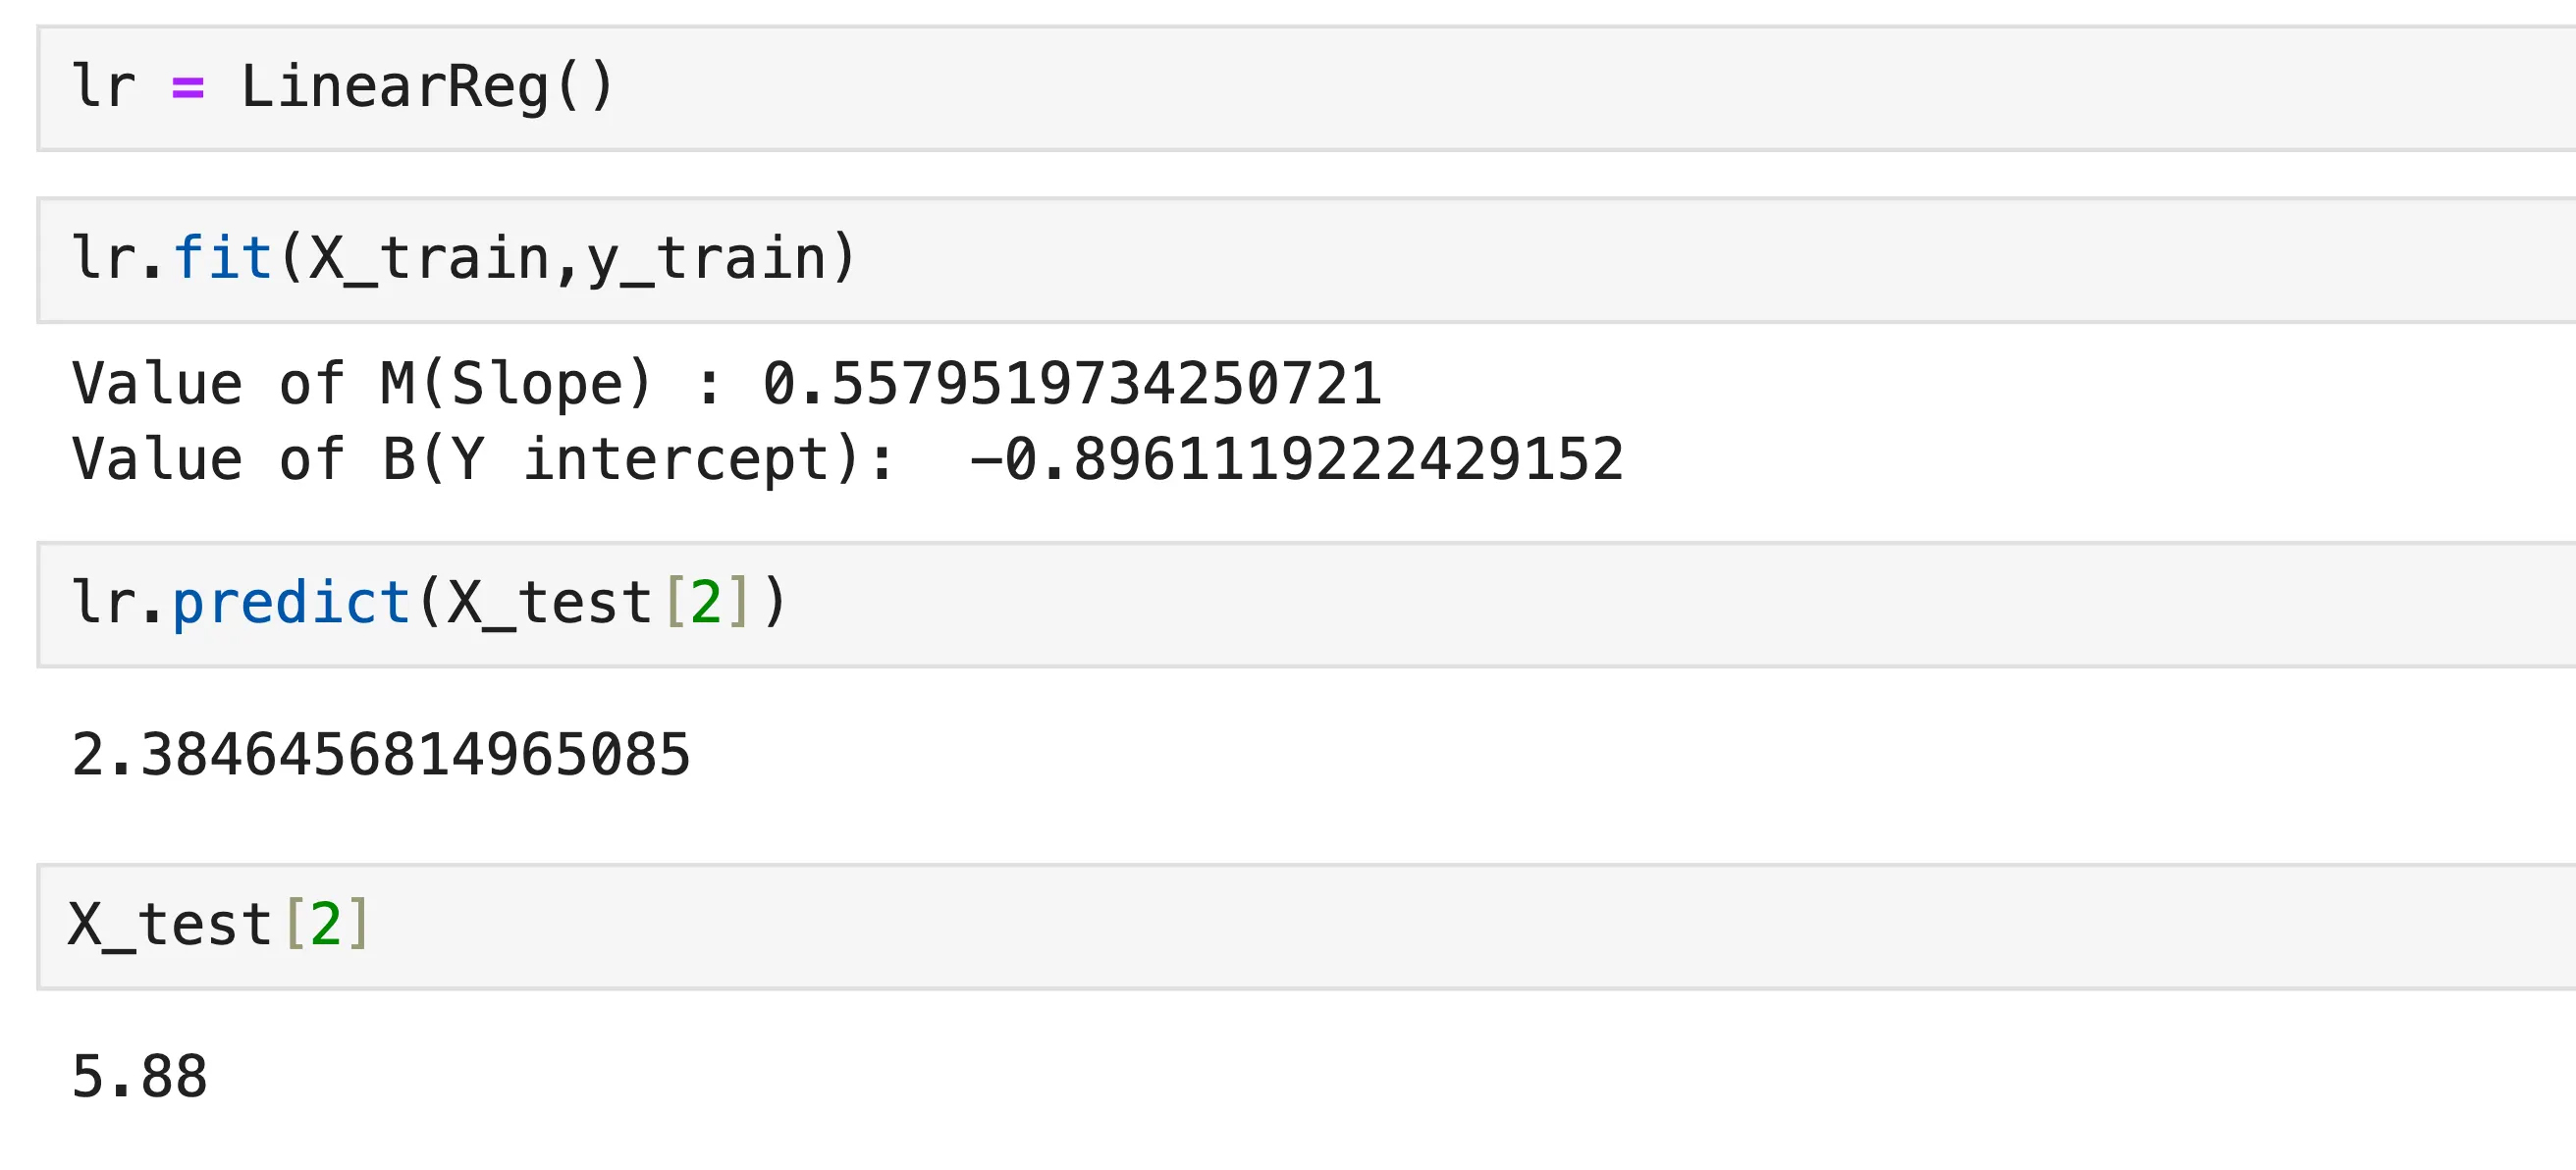
After training on the dataset, when we input a CGPA value of 5.88, our model predicted that the package would be 2.38 LPA.
7. Summary
Linear Regression is a simple algorithm with the goal of fitting a line to linear data. This line, known as the best fit line, passes as close as possible to all data points while minimizing the overall error.
There is much more to Linear Regression, especially when we explore methods like Gradient Descent. However, this example of Simple Linear Regression is helpful for understanding the basics of the algorithm and how it works — something that might not be fully clear just by reading its definition.